Is Ethereum (ETH) doomed to stop shining ? Despite showing strength during the bear market, Ethereum is struggling to regain its former glory. Is ETH destined to remain in Bitcoin’s shadow in the coming weeks? Let’s see what to watch for signs of Ethereum’s comeback.
It’s Wednesday, April 17, 2024, and Ethereum (ETH) is trading around $3,100.
Times are tough for Ethereum. Since its major update ‘The Merge,’ the project has been underperforming Bitcoin to the extent that it’s shaking at its core fundamentals.
But it’s in these difficult times, of disinterest, that the best opportunities arise for an asset.
Although the competition from layer 1 solutions capable of executing smart contracts seems stronger than ever, with the Securities and Exchange Commission (SEC) adding fuel to the fire with a potential financial classification, is Ethereum capable of regaining momentum?
Let’s take a technical look !
Decrease in leveraged positions and series of major liquidations
Since its lows in 2022, Ethereum has been building a strong underlying bullish trend. It’s a powerful underlying trend that doesn’t overtly display its strength but rather builds it over the long term. However, the correction initiated in recent days may appear worrisome.
Is ETH really in trouble? What should we watch for on this asset?
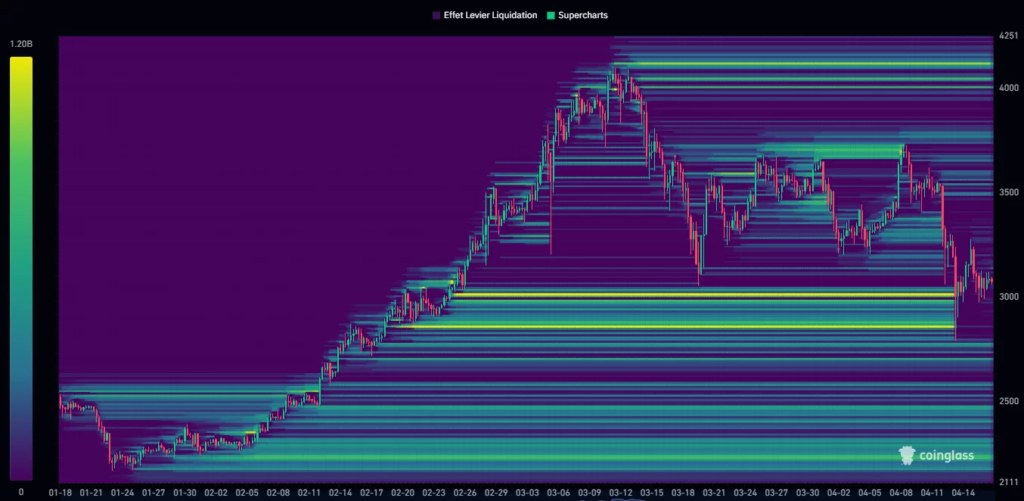
We’ve seen a broad liquidity hunt in recent days. Pockets below $3,000 have been wiped out, leaving a large gap between $3,400 and $2,800.
We are now in a state of suspension, balancing between the liquidity we might seek to the north and south, and unfortunately, this gives us no indication of the direction the asset could take.
However, it’s worth noting that there are many pockets below $2,600, with a technical zone to target around $2,200. To the upside, liquidity zones are more scattered. Nevertheless, the coming days could offer us a range conducive to building new pockets.

On the liquidation front, the past few days have played out in line with the year’s highs. These spikes in liquidations have consistently been detrimental to long positions.

These liquidations have led to a decrease in open interests in derivative markets, dropping from $13 billion to $10 billion. This represents a decline of approximately 23% in just a few days.
However, we can observe a slight disengagement from professionals. Indeed, open interests at the CME for ETH have decreased by 40% since March 15th.
It’s particularly interesting to note that during the three liquidation peaks in March and April, overall interests returned to the same level ($13 billion), but the share of the CME gradually decreased.
This movement is likely linked to a decrease in confidence regarding the approval of a spot Ethereum ETF.
It’s also a potential arbitrage move aimed at reducing risk on Ethereum, which is facing new attacks from the SEC.
Professional exposure to Ethereum is an indicator to watch in the coming weeks. Strong exposure from this investor category is often a very positive sign for an asset.

Ethereum remains strong in the long term, short-term it approaches expected retracement level
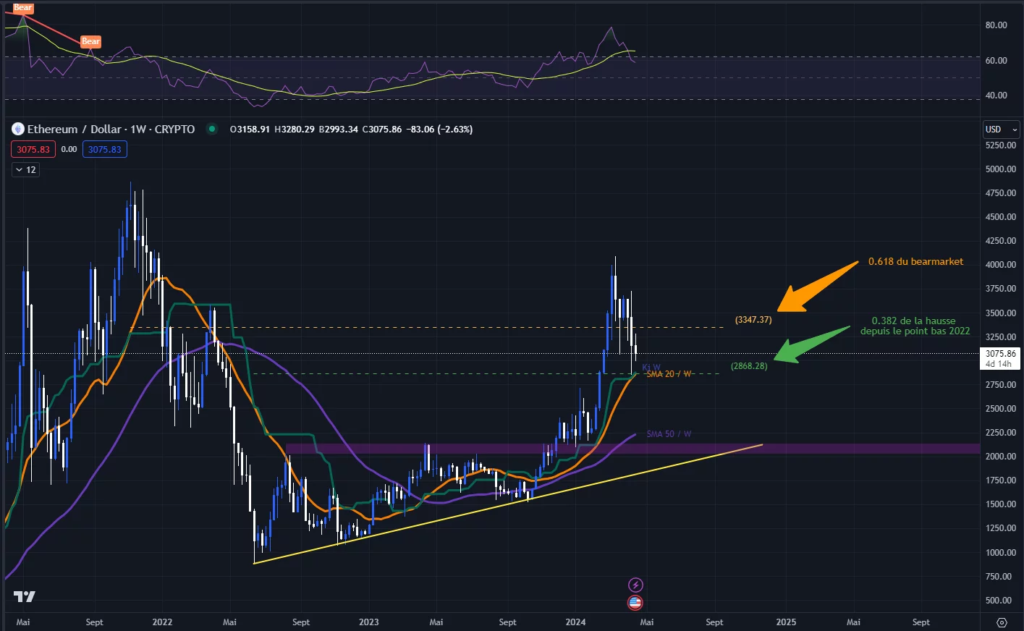
ETH is one of the assets that presents one of the most enticing charts since its lows in 2022. It navigated the bear market showing strength through an ascending triangle formation.
The breakout from this triangle was expected to lead it towards the $3,200 target, which it achieved after testing and working through the breakout zone for several weeks.
Now it’s a conjunction of dynamic supports: weekly Kijun, 20-weekly Moving Average, and the Fibonacci retracement at 0.382 that we’re working with as support around $2,800.
This level will be the guarantor of a short-term bullish continuation, which would be invalidated if breached and closed below on a weekly basis.

Two camps are at odds, unlike Bitcoin which remains close to its previous all-time highs. Ethereum has re-crossed the 0.618 retracement level from the bear market, putting it in a potential rebound position towards the south.
It’s a scenario I’m not considering at the moment, but we can’t completely disregard it, as it provides ammunition to the bearish camp. It will be necessary to quickly reconquer the $3,400 zone to erase this potential scenario from the charts.
Against Bitcoin, Ethereum is at its lowest point in 3 years. It’s trading below the June 2022 zone, which corresponds to its bear market low against the dollar. This is a significant level that is crucial to monitor as it will provide valuable information.
One hypothesis is that it may build a deviation below its range before reclaiming the green zone, breaking the downtrend line, and heading upwards. This scenario would signal strong relative strength against Bitcoin.
So, we’re waiting to see this strength return to the second-largest asset in the crypto market. In any case, for now, Ethereum is showing the greatest difficulty in regaining investor commitment.

In summary, Ethereum’s ETH remains bullish and structurally sound. The levels we are retesting are key to this short-term continuation, and we may have experienced excess panic around current geopolitical events.
Many signals indicate that we are potentially in a good recovery zone; however, breaking below the $3,300 to $3,400 zone is not an excellent signal.
It will be important to quickly reclaim this level and establish support.
So, do you think ETH could already head towards a new price record?
Feel free to share your opinion in the comments.
Have a great day, and we’ll see you next week for another technical analysis.


One Response