The 4th Bitcoin halving has taken place without any issues. What levels should we watch for on the cryptocurrency as we await a move in its price ?
It is Monday, April 22, 2024, and the price of Bitcoin (BTC) is trading around 66,000 dollars.
A new era begins for Bitcoin this week. The 2024 halving is behind us, reducing the supply at its source by lowering miners’ rewards. In the history of BTC cycles, this event is often associated with a sustained increase in the weeks and months that follow.
The macroeconomic front is also notable this week, with two significant data releases that could impact markets and cause price fluctuations. Indeed, the first estimate of the US GDP for the first quarter of 2024 will be released this Thursday. On Friday, the focus shifts to inflation with the PCE report.
These numbers are crucial because they will prompt market participants to adjust their projections. This will lead to an arbitrage strategy aimed at recalibrating their exposure to risky assets.
Specifically, after the disappointment of the last CPI inflation figure, the PCE report will be highly anticipated!
In a context where geopolitical tensions in the Middle East seem to have eased, the crypto market is taking a breath with a technical rebound from key support levels.
Will the positive fundamental news from the Bitcoin network, following the successful completion of its 4th halving, help transform this technical rebound into something more substantial?
Institutional appetite weakens, but retains relative stability – Derivatives markets are calm
Volumes on Bitcoin ETFs have been declining since early March. The early movers in this category of investors may have already allocated the capital they wanted to risk in the crypto market in the short term.

However, the flow manages to balance out, with volumes slowing equally for buying and selling. This slowdown appears consistent with the reality of opening a new market. After an initial wave of strong activity, a quieter period is expected to set in.

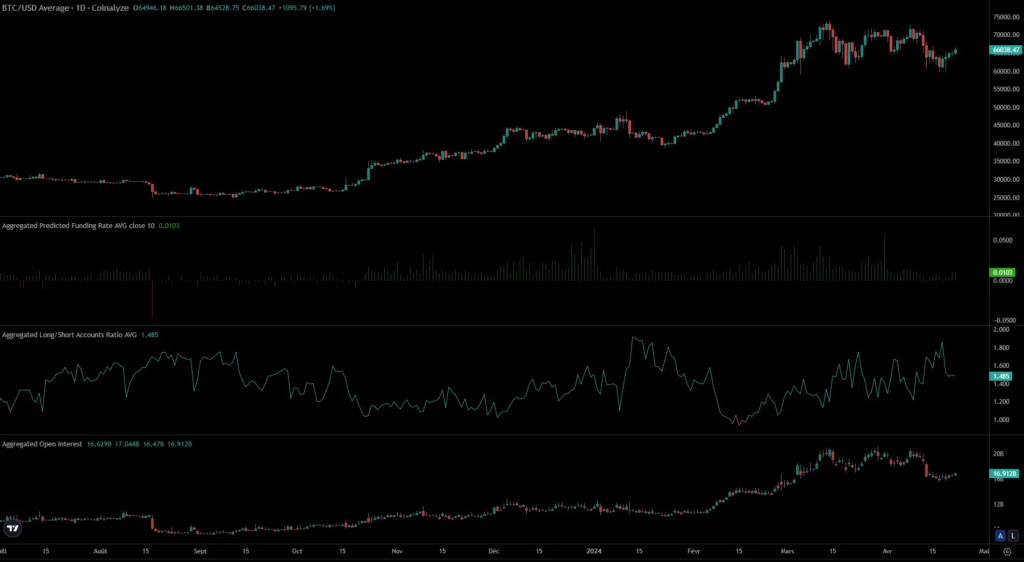
On the derivatives market, we can see that fundings are at their lowest since the beginning of Bitcoin’s current range. There has even been an accumulation of short positions since April 9, reflected in a rising long/short ratio.
We can observe two bearish spikes on April 12 and 18 when fundings turned negative. Shorts were then paying longs to maintain their positions. This is a rare occurrence in the crypto market, especially on timeframes like the daily.
Since April 19, longs seem to be gaining ground in a context where capital in the derivatives market remains generally stable. Some short positions are closing, while, at the same time, longs are being opened with an equivalent capital weight.
We should now monitor the level of open interest and the market’s direction as it approaches the upper and lower bounds of the range.

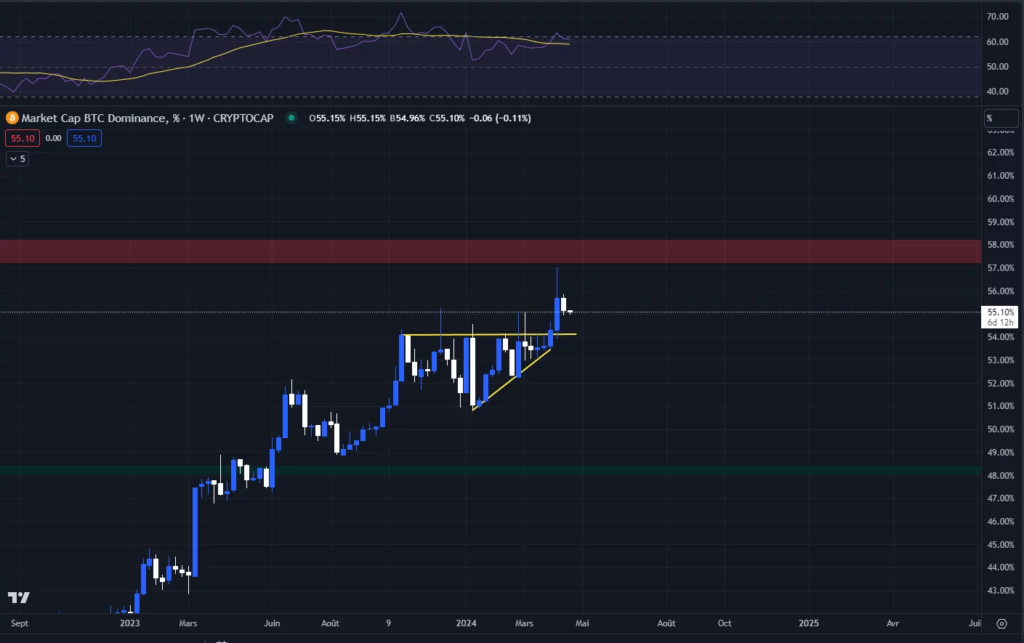
Bitcoin’s dominance over altcoins retraces to 55%, while the ETH/BTC pair drops by 0.60% over the week. As a result, Bitcoin is losing ground, and some capital is returning to the altcoin market. This shift remains quite measured. We should monitor the test of the top of the ascending triangle (around 54%) to understand the future direction of this movement.

BTC reenters its weekly range !
After testing the $60,000 level, Bitcoin has managed to reenter its weekly range by the end of the week.
Reentering a range is often a good sign for retesting the opposite boundary, which could give us a first target of $70,000 or higher.
In the short term, the trend remains neutral; the asset is heavy. This week is expected to bring macroeconomic events that tend to lead market participants to reduce risk.
Therefore, we anticipate a week characterized by consolidation of the ongoing technical rebound.
It’s also a week where we must watch the impact of the “halving” narrative.
Will this narrative give Bitcoin the strength to explore price discovery beyond its all-time high (ATH) ?
We’re in a crucial period for the direction of Bitcoin as well as the entire cryptocurrency market. The goal will be to hold $64,000 at the weekly close.
On the daily chart, we need to monitor whether $60,000 holds to avoid a drop toward our dynamic supports, Kijun and the weekly SMA20. To the upside, a close above $66,867 would be a positive sign for a return toward the previous 2021 ATH and then the opposite boundary of the range.

We might continue to stay within this range as long as there’s no catalyst in the markets that allows us to break out of it.
Macroeconomic data, geopolitical news, changes in Fed policy, or a second wave of institutional buying are all elements that could act as a catalyst.
Moreover, the question we are asking is whether the halving will be strong enough to serve as that catalyst.
Indeed, if the upward movement in recent months has primarily been driven by institutional pressure, we’ve seen that this pressure is diminishing. Other investor classes will now need to take over to push Bitcoin higher.
In the meantime, the range should be the focus, but overall, the major levels haven’t changed since last week. To the south, we have the dynamic support created by the confluence of the SMA20 and Kijun. To the north, a renewed uptrend is contingent upon surpassing the all-time high of 74,000 dollars.
In summary, Bitcoin remains fundamentally bullish and could eventually resume its upward trajectory towards 84,000 dollars if it manages to break out of the current range from the top. To the south, we have a support level around 55,000 dollars in case of a more significant correction.
Do you think BTC could already be on its way to setting a new price record?
Feel free to share your thoughts in the comments.
Have a great day, and see you next week for another Bitcoin (BTC) analysis.
Sources : TradingView, Coinglass, Glassnode


