Bitcoin is experiencing an 8% correction this week, while geopolitical and macroeconomic tensions contribute to market turbulence. Despite this, BTC manages to maintain its position above $60,000.
What can we expect from Bitcoin in terms of technical analysis ?
It’s Monday, April 15, 2024, and the price of Bitcoin (BTC) is trading around $64,000.
At the end of the week, bond yields and the dollar regained strength following disappointing CPI (inflation) figures. Market participants in the traditional market then expressed doubts about expectations of a pivot in interest rates in 2024.
Consequently, the market tightened, and the VIX (indicator of market fear) reached levels not seen in about 6 months.
In the context of macroeconomic and geopolitical tensions in the Middle East, the crypto market experienced a violent correction. However, Bitcoin has proven to remain a strong crypto asset by correcting to a lesser extent compared to other cryptocurrencies. At the time of writing, it manages to maintain above $60,000 and achieve a nice absorption wick in the weekly close.
The Bitcoin corrects by 8% over the week.
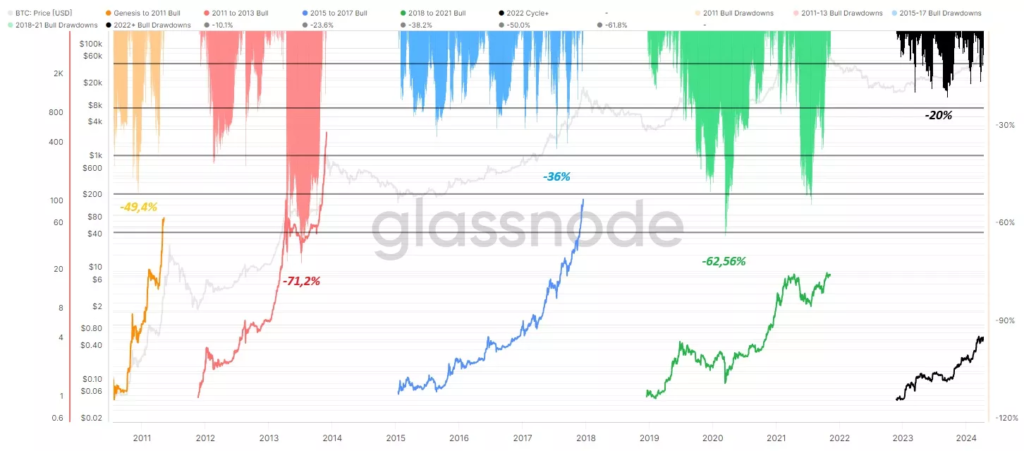
The correction initiated on Thursday, April 11, has a magnitude of approximately 15% from wick to wick. This remains reasonable when considering the history of Bitcoin’s bull markets.

This significant movement led to numerous liquidations in the crypto market: by clearing out a large portion of liquidity to the downside, open interests were significantly reduced while remaining in zones equivalent to the extreme phases of the previous bull run.

While there are still significant liquidity levels around $57,000 (below the low point of March 5, 2024), the bulk of liquidity is now in the $70,000 range.
This casts doubt on a scenario in which a final liquidity hunt could occur below these levels before resuming in the direction of the primary (bullish) trend.
The dominance of BTC over altcoins rises to 57%, while the ETH/BTC pair drops by 7.94% over the week. Consequently, Bitcoin dominance revisits a pivot it hadn’t reached since August 2020.
This zone is expected to create friction regarding Bitcoin’s price against the rest of the market. Indeed, it may lead investors to allocate their crypto portfolios more favorably towards altcoins in the coming weeks. This could be even more coherent as many projects have reached medium to long-term buying levels.
BTC Trading in a Range Between $60,000 and $74,000 ?
The primary trend is resolving bullish on Bitcoin.
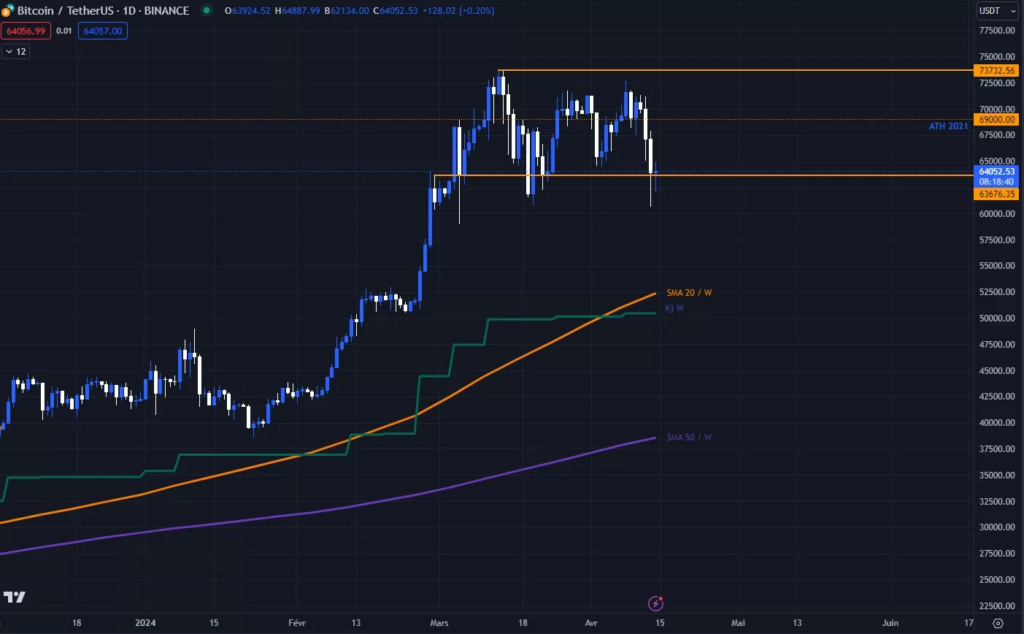
The invalidation levels are far below us, as we would need to reach the 50-week moving average around $38,000 and surpass it to get a strong sell signal.
An intermediate zone is also worth considering at the confluence of the Kijun and the 20-week moving average. These currently correspond to the price action zone from February 2024.
In the short term, the trend is neutral, stuck in a range between $64,000 and $74,000. The previous ATH from 2021 serves as the midpoint of this range, acting as our pivot between the bull and bear camps.

This range could be tested in the hours ahead, especially given the current complicated context.
If it were to break, we could move down a level and establish a new range above $52,000. Indeed, significant corrections typically require a period of digestion and rebuilding.
If we were to retrace to the indicated level, the correction would fall within the standards of a 30% correction in a traditional bull market.
In summary, Bitcoin remains bullish overall and could eventually resume its upward trajectory towards $84,000 if it manages to break out of the range to the upside. To the downside, we have a more pronounced correction with a support level around $50,000.
So, do you think BTC could already head towards a new price record ?
Feel free to share your opinion in the comments.
Have a great day, and we’ll see you next week for another analysis of Bitcoin (BTC).
Sources : TradingView, Coinglass, Glassnode


Can you be more specific about the content of your article? After reading it, I still have some doubts. Hope you can help me.
Tell me, what exactly do you want to know?