Solana has made a strong technical rebound after a major correction. What are the key technical indicators to watch to turn this rebound into a quest for new highs?
It’s Tuesday, April 23, 2024, and the price of Solana (SOL) is around 155 dollars.
Solana rebounded after visiting the Weekly Kijun at $115, regaining the historical level around $150 in a technical move.
The trend remains firmly bullish, but in the current context, can Solana’s SOL continue this momentum and aim for new highs?
Liquidity and derivatives market: An overview of Solana
In recent days, Solana has experienced a strong technical rebound. This rebound has created small pockets of liquidity beneath each of the ascending troughs. These could be targets for a brief sweep if the market seeks to eliminate speculative excesses before driving the price action northward.
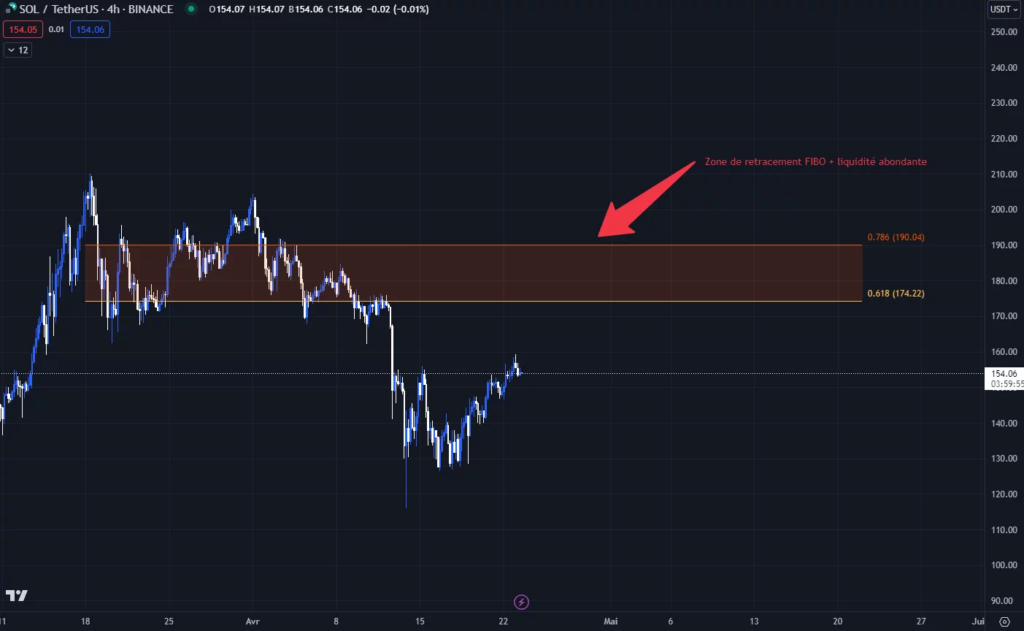
In the medium term, however, the area between $175 and $190 is quite appealing to the market.
It’s filled with pools of liquidity, which are less significant than those below $100 but more accessible.
The area with an abundance of liquidity aligns perfectly with the Fibonacci retracement zone (0.618 to 0.786). This is a region where selling interest could return. If the bears aim to push the chart toward a new lower low, this is where they would need to act.

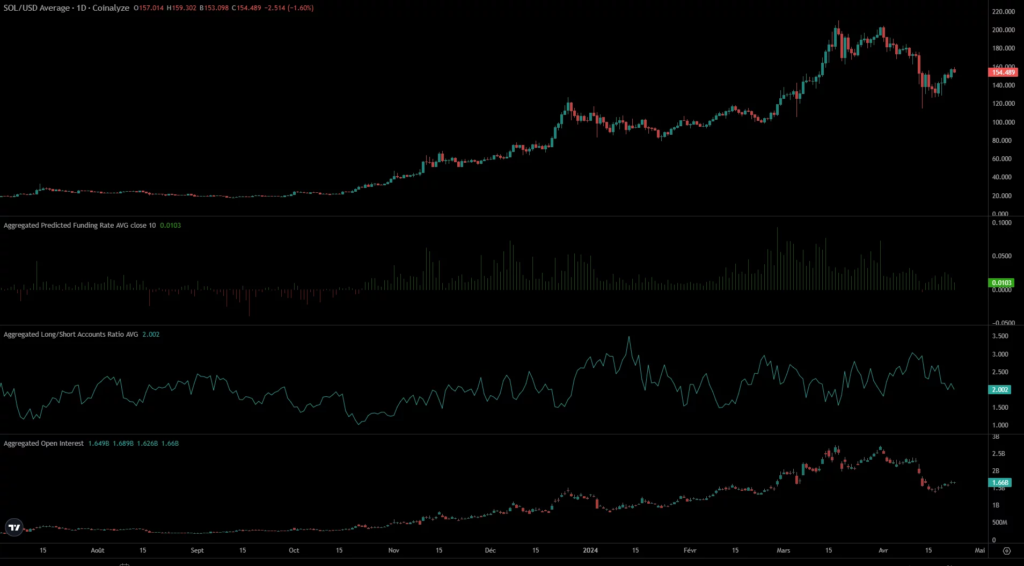
On the derivatives side, the recovery is progressing steadily. The price increase doesn’t seem to be sparking speculators’ excitement, which is conducive to building an organic bullish trend. Fundings are at lower levels compared to recent months.
The long/short ratio shows a decrease in short positions since April 10, while open interest remains steady, indicating a rotation from shorts to longs in the short term. However, the short position level is still higher than during the March and April peaks, signaling a more bearish bias than before.

Solana’s SOL constrained between various dynamic levels!
Solana’s SOL is stuck between the daily and weekly 20-period moving averages, reflecting opposing trends in the short and medium term. The daily trend shows a bearish configuration, while the weekly trend points upward.
For these trends to realign, the daily moving average at 158 dollars must be breached and then regain a positive slope, which requires staying above 158 dollars for several days.
This alignment of moving averages suggests a range scenario between these two dynamic levels. It might lead to price compression with potentially explosive outcomes. A breakout of one of these levels will give us the indication we’re waiting for regarding the asset’s direction.
To clarify, there’s potential resistance in the north, with the closing Bollinger Band creating a friction zone.In the south, the flat SMA 20 weekly and the flat Bollinger Band create a strong support zone.

These technical elements highlight two likely scenarios for the coming days:
- A new pullback toward the confluence of the weekly SMA 20 and the lower daily Bollinger Band, forming a higher low with the goal of a rally toward liquidity above 174 dollars.
- A quick liquidity hunt toward the 174 to 190 dollar zone. At these levels, a battle is likely to develop between the two sides, determining the next movement (new high or a return to a lower trading zone).
Following the corrections of the past few days, Solana is bouncing back with a convincing technical rebound. To move beyond this rebound, resistances must be overcome, and battles against the bearish camp must be won.
So, do you think SOL can push towards a new record high ?
Let us know your thoughts in the comments.
Have a great day, and we’ll see you next week for another technical analysis of altcoins.
Sources : TradingView, Coinglass, Glassnode


