Bitcoin remains in a consolidation phase within a range it has been building for the past 2 months. While this may be trying for the impatient, this consolidation is healthy and necessary to sustain the underlying bullish trend. Can we expect a resolution soon ?
It’s Monday, May 13, 2024, and the price of Bitcoin (BTC) is hovering around $62,500.
The sideways phase above $60,000 continues within a short-term daily downtrend. It’s a slow agony testing investors’ psychology, a phase of doubt conducive to capitulation among market participants, leading to asset transfer between weak and strong hands.
This week, macroeconomic events will be decisive with two interventions by Fed Chairman Jerome Powell. The first is scheduled for Tuesday, May 14, at 4:00 PM, while the second will take place on Sunday around 9:30 PM.
It’s also the return of inflation data with the CPI figure expected to be released on Wednesday, May 15, at 2:30 PM. These events are sure to animate the week by catalyzing price movements.

In a market undergoing consolidation, patience is being put to the test. Therefore, what are the levels to watch on Bitcoin for a breakout from this range ?
Bitcoin miners facing fundamental changes post-halving
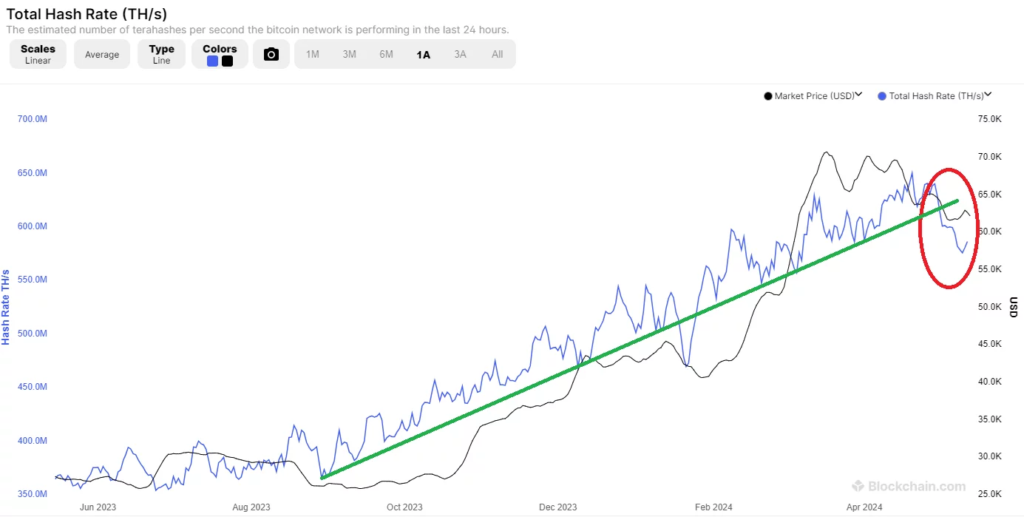
Since the second half of 2023, Bitcoin’s hashrate has been on a sustained upward trend. However, in recent days, we have observed a decline in the overall computing power of the network.

The halving is typically a stress test for Bitcoin mining companies. They have to contend with rewards halved by half and a constant struggle for competitiveness. Moreover, the current price of Bitcoin is below its average production cost. On Sunday, May 5, the production price peaked at $94,320 before gradually falling to around $72,600 by Sunday, May 12.

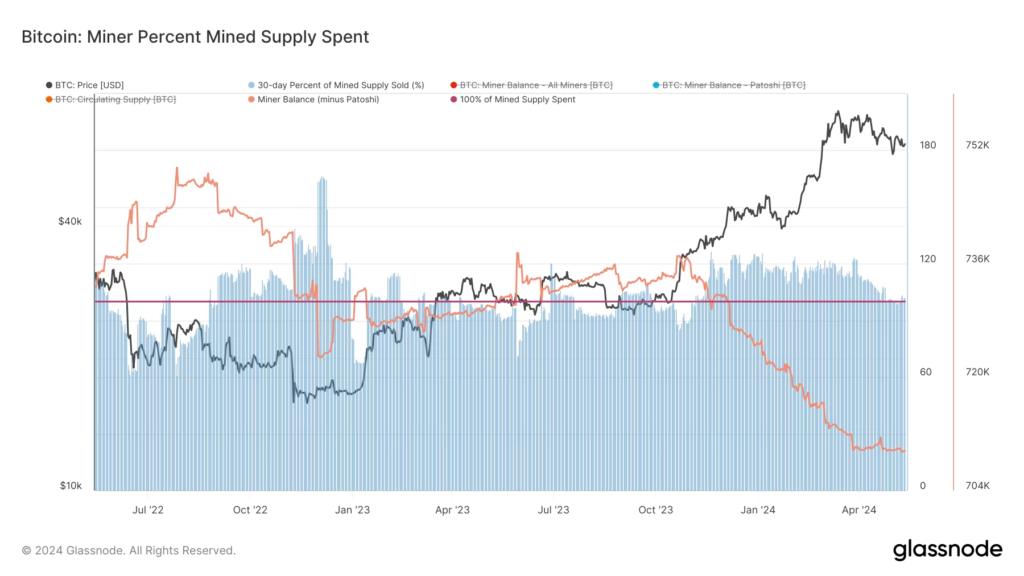
Bitcoin miners hold significant reserves of BTC. This could be a significant source of selling pressure if they were forced to sell consistently to cover their operating expenses. It is this capitulation that could generate the next major fundamental event that would impact the price of BTC.
However, miners seem to have prepared well to navigate through a challenging period. Indeed, with the price of Bitcoin having risen significantly ahead of the halving, we have observed excess recurring sales since late 2023. These, however, tapered off in March, suggesting that BTC miners’ treasuries were at their peak.

Miners anticipated the reduction in blockchain security operation revenues by accumulating treasury. An adjustment of the mining fleet is likely underway, explaining the decline in hash rate: operators are unplugging older machines that no longer offer sufficient returns.
However, this period should ideally be as short as possible for them to meet the challenge of this transition without too much pressure. The data presented above will therefore need to be closely monitored in the coming weeks.
BTC consolidates within a daily descending channel range
Let’s be beyond any doubt the April candlestick, which shapes a bearish immersing design on the near. This design is indeed more critical because it happens at a key level:
the past 2021 all-time tall. Whereas the medium and long-term patterns are bullish, the chart sends us an critical caution.
Hence, to relieve the impacts of the April candlestick, it is basic to recover at slightest the $65,000 level. This level constitutes the extremity zone characterized by the Japanese candlestick of April.
I propose taking a closer see with the day by day surrounding underneath:
a run between $59,000 and $71,500. Two deviations have shaped over and underneath the run. For the most part, such a progression of deviations offers great probabilities of encourage upward continuation.
However, several obstacles still need to be overcome:
- the daily downward channel;
- the polarity zone at $65,000;
- the previous all-time high at $69,000;
- the upper bound of the range.
The target in case of surpassing all these obstacles is a visit to $84,000.

On the contrary, the bearish scenario involves breaking below the lower bound for a further downward continuation within the daily channel. The target is then a new low below $56,500. In this case, we should consider a probable return to the 50-week moving average, currently at $42,000.
In summary, Bitcoin continues to consolidate above $60,000, remaining in an overall bullish trend. The daily downtrend is compressed between the lower bound of the range and the resistance of the channel. This compression raises hopes for an imminent breakout.
So, do you think BTC could already be heading towards a new price record ? Feel free to share your thoughts in the comments.
Have a great day, and we’ll see you next week for another analysis of Bitcoin (BTC).
Sources : TradingView, Coinglass, Glassnode


Leave a Reply